A city-wide epidemic
In 2025, Berlin police logged 25,811 bike thefts, one roughly every 20 minutes, all year round. Just 137 were failed attempts; the rest succeeded.
€32.8Min declared value stolen in one year, an average of €1,281 per bike.
Python · D3 · Berlin Polizei open data (2025)
The map of risk
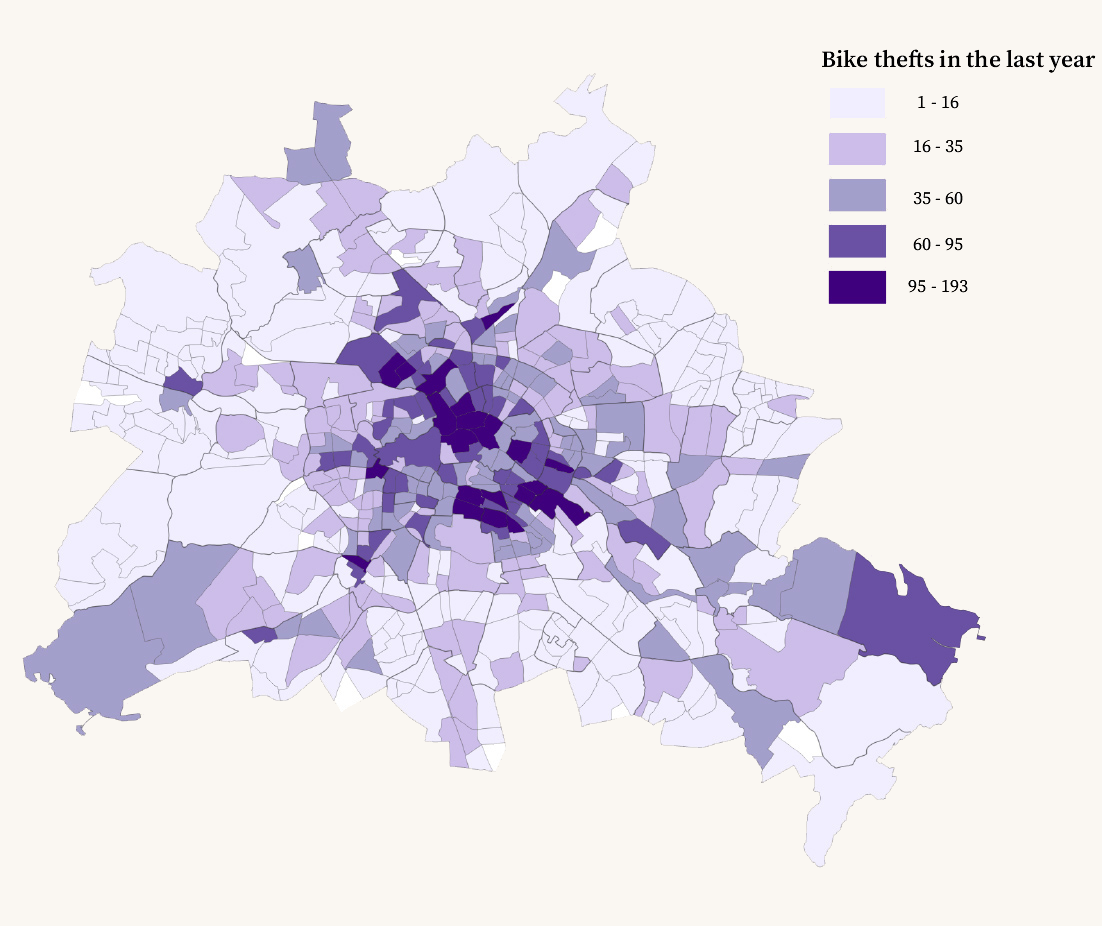
At planning-area resolution the pattern is unmistakable: theft concentrates in the dense inner city and the eastern Kieze, thinning toward the outer edges. This is the exact choropleth from the original QGIS analysis, shaded by thefts per Planungsraum.
A handful of areas carry the load
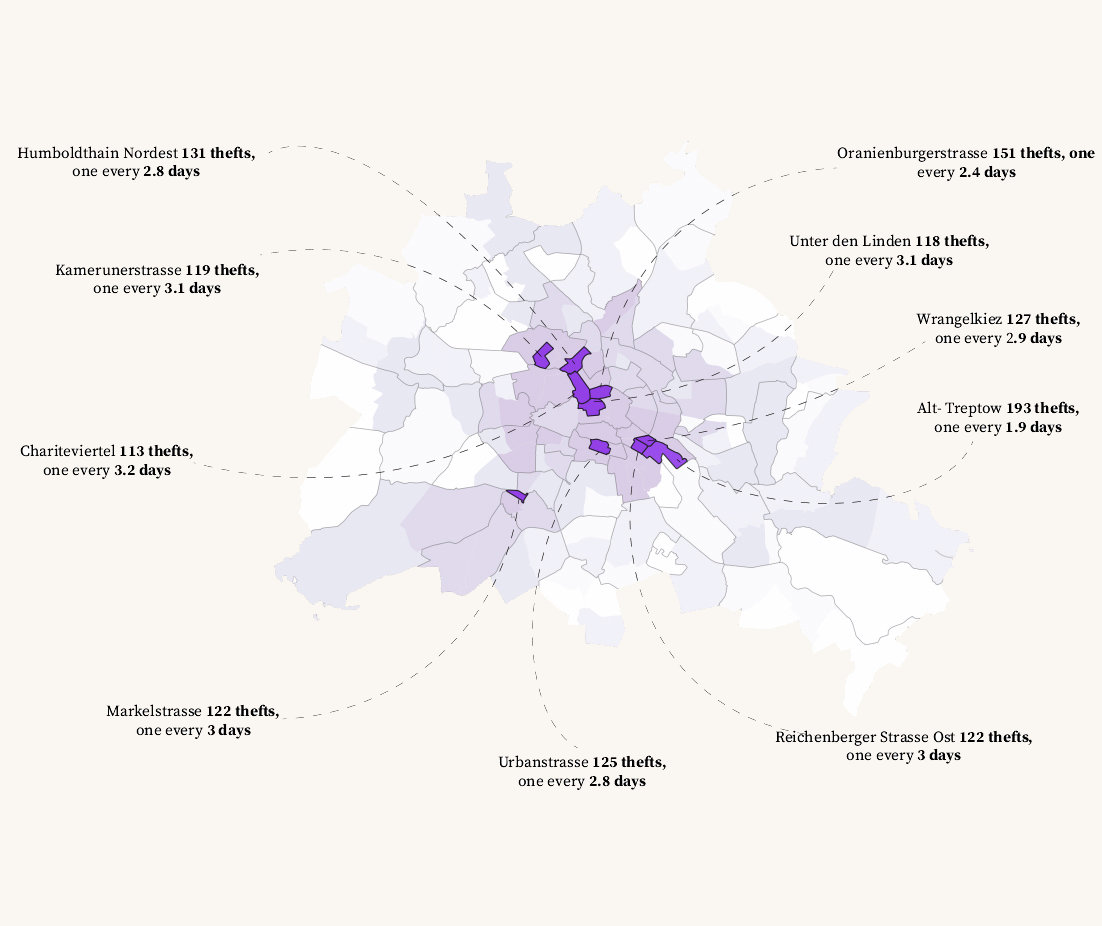
Drill down to planning-area level and a few names dominate. Alt-Treptow tops the list, a bike stolen roughly every 1.9 days, followed by Oranienburger Straße and Humboldthain. High-footfall corridors around stations and nightlife generate a strikingly outsized share of all thefts.
Almost half the thefts, three districts
Zoom back out and the concentration is stark. Just three of Berlin's twelve districts, Mitte (17%), Friedrichshain-Kreuzberg (15%) and Pankow (12%), account for 44% of every bike theft in the city.
Central districts, early evening
Read the heatmap and two patterns jump out. The top rows, Mitte, Friedrichshain-Kreuzberg, Pankow, glow brightest. And the darkest column sits at 18:00: theft peaks in the early evening, not at night. Bikes are taken while owners run their last errand of the day.
The district league table
Switch the ranking between raw theft count and total declared value, the order shifts as wealthier districts lose fewer but pricier bikes.
Everyday bikes, not just expensive ones
The most-stolen categories are ordinary men's and women's city bikes, the workhorses of daily Berlin life. High-value road and cargo bikes are rarer targets but pull up the average loss.
Median loss: €900
Declared values span sub-€100 commuters to €5,000+ cargo and sporting models. The median loss is €900; the mean €1,281, pulled up by a long tail of expensive e-bikes and cargo bikes.
€900median declared value per stolen bike.