Long-form investigations, reported and built from scratch, where the graphics carry the argument rather than decorate it. Click any cover to scroll the full story.
Live, explorable charts — hover, filter, and drag to read the data directly.
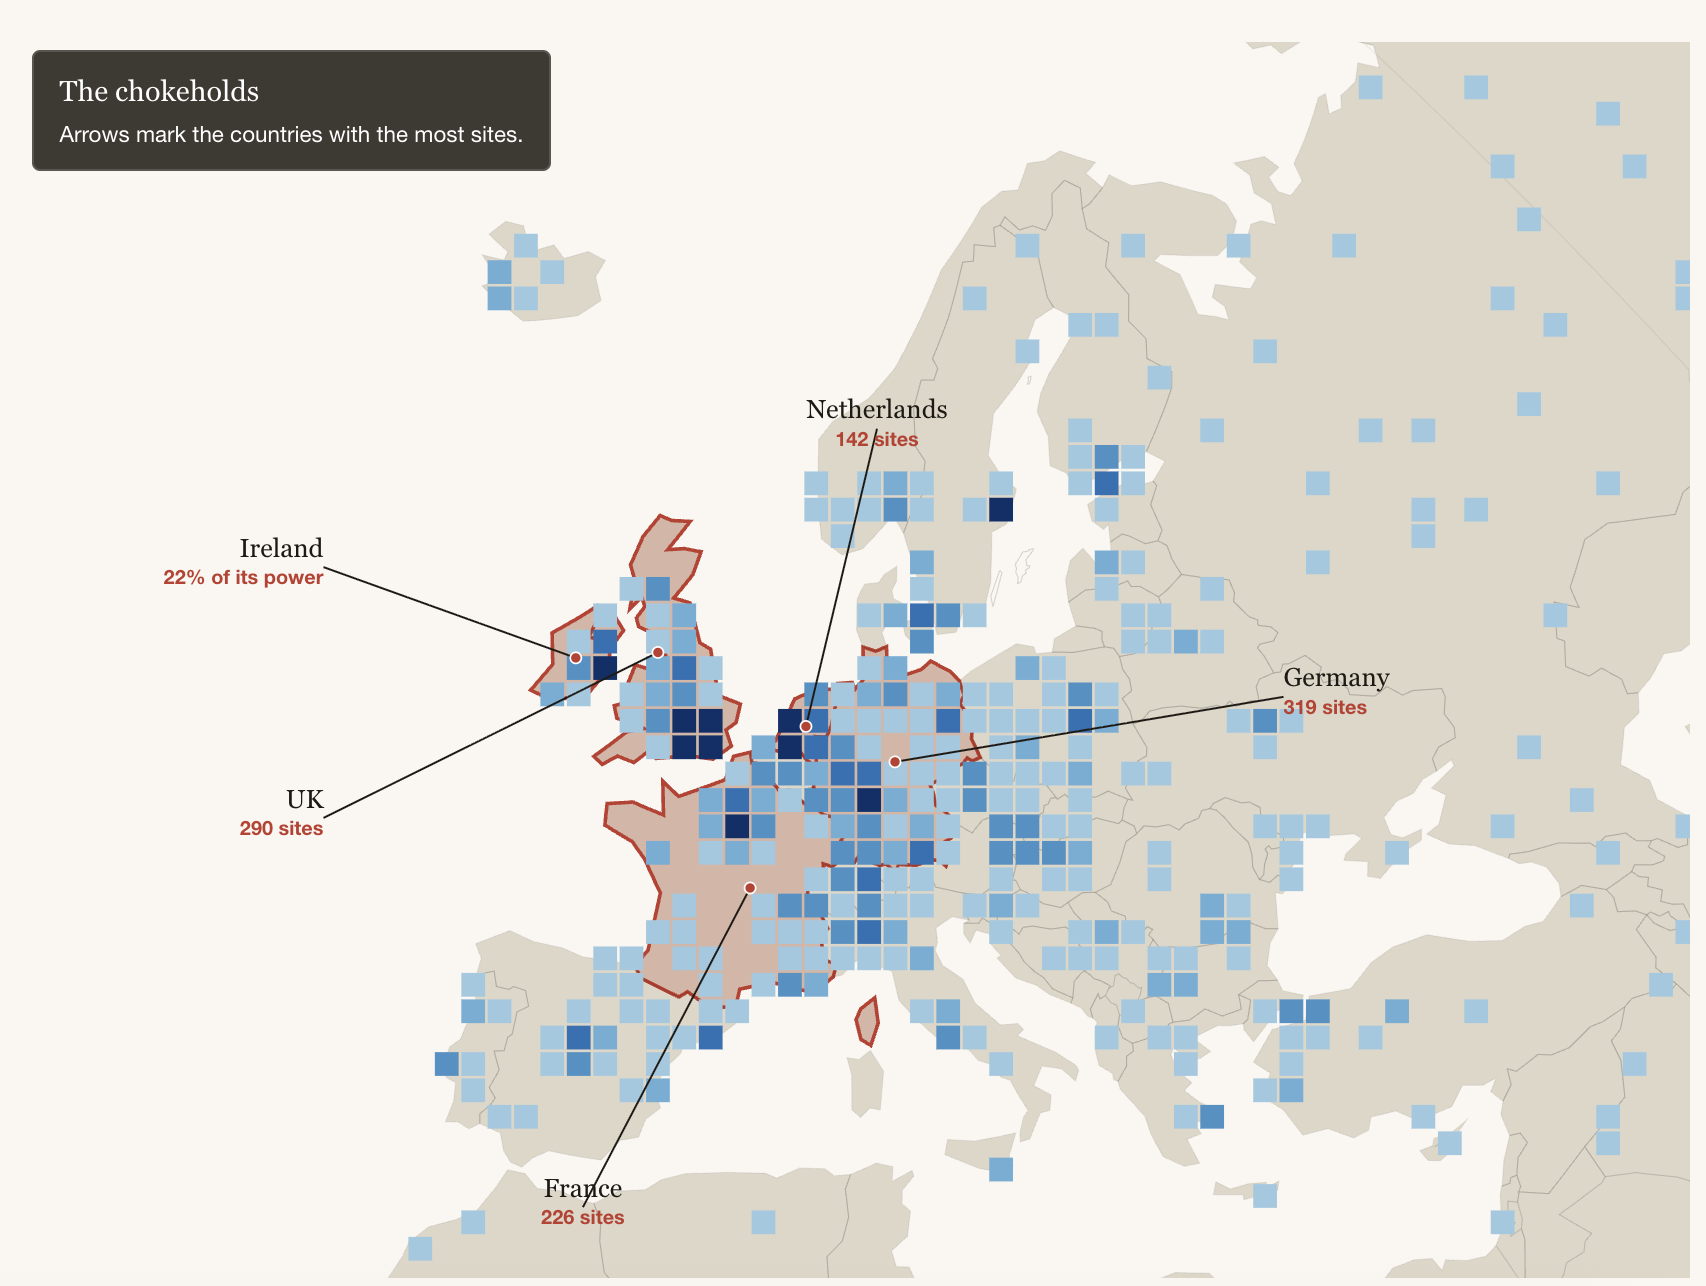
Internet warehouses — where Europe keeps its data centres
~2,022 data centres aggregated to a 100 km grid · hover a cell or country for counts · click a country to isolate it · toggle "Highlight chokeholds" to see the four countries that dominate — Germany, the UK, France and the Netherlands
Data centre locations approximate & illustrative, aggregated to a 100 km grid · Basemap & borders: Natural Earth · Energy comparison: ~10 MW average facility, EU household ≈ 3,500 kWh/yr, fridge ≈ 150 kWh/yr
Miete, Leerstand, Eigentum — Deutschland, Gemeinde für Gemeinde
Alle 10.990 Gemeinden aus dem Zensus 2022 · Datensatz und Ranking umschaltbar · Karte und Balken sind verlinkt — einfach drüberfahren
Bundestagswahl 2025 — Deutschland, Wahlkreis für Wahlkreis
Alle 299 Wahlkreise · Gewinnerkarte oder Erststimmenanteil je Partei umschaltbar · Hochburgen, knappste Rennen und Swing vs. 2021 — Karte und Balken sind verlinkt
WBeachtet, aber kaum beschrieben — Aufmerksamkeit im Bundestag · nach Wikipedia
Jeder Punkt ein:e Abgeordnete:r · x = Wikipedia-Aufrufe (6 Monate, log) · y = Artikellänge · Farbe = Partei. Die zehn meistgesuchten Abgeordneten stehen für rund ein Drittel aller Aufrufe — der Median liegt bei nur ~3.700.
Y-Achse
Partei
Wikipedia (de) · Seitenaufrufe ohne Bots, · Artikellänge in Zeichen · Bearbeitungen = Versionen der letzten 6 Monate · 2 von 630 ohne Artikel (nicht dargestellt)
Die Erde bebt — die stärksten Erdbeben
Stärkste Beben weltweit · Blasengröße = Magnitude · Farbe = Herdtiefe · Jahr umschalten · Maus über ein Beben
Quelle: USGS Earthquake Hazards Program · Beben weltweit, 2025 (836 stärkste) und 2026 · Visualisierung: Datawrapper-Symbolkarte
POLITICO Europe · 2023–2026
Selected works
EU policy journalism across energy, climate, electoral behaviour, industry and technology. Produced at POLITICO Europe — all rights reserved, reproduced for portfolio demonstration only
Get in touch.
Open to data journalism roles, freelance visualization projects, and research collaborations.